Table of Contents
Mapnik on iOS
Mapnik runs natively on iOS since v2.2.0. Previous versions of the code would run fine on iOS, but the build system was not adapted to easily produce binaries, so in reality v2.2.0 is the first version to support iOS.
A Mapnik iOS SDK is available that includes everything in a single place to leverage Mapnik on iOS:
It includes:
- Mapnik as a static library (
libmapnik.a) - All Mapnik headers
- All libraries and headers of all Mapnik dependencies
- Mapnik datasource input plugins compiled statically into
libmapnik.a
Supporting reading images
If you need Mapnik to support reading images, then you need to compile the image readers directly into your app because otherwise they will not be available. Specifically what this means is that if you want Mapnik to be able to load PNG's and you are using Mapnik v2.2.0 then you need to:
- Grab this cpp file
- Comment out these two lines
- Drop the
png_reader.cppinto your project code folder and then - Include it in your
.mmfile like:#import "../png_reader.cpp" - At app startup (like in
viewDidLoad) callregister_image_reader("png",mapnik::create_png_reader); - If you want to support reading images from a in memory stream also do
register_image_reader("png",mapnik::create_png_reader2);
Profiling
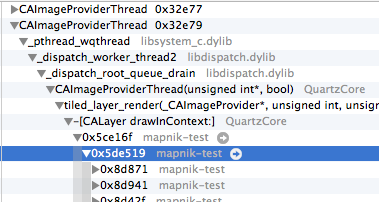
Read this if you want to use the Time profiler in Instruments.app to profile your app using Mapnik. By default if you try this you will see a call graph like this:

Where mapnik-test is the name of the app: notice the actual symbol names are missing. This makes it impossible to know which functions are being called.
To fix this you need to know several things about your build setup and XCode and then you will be equipped to set up Instruments to get access to your function symbols (and the ones inside Mapnik).
You also need to have you project in XCode configured to write .dSYM files for debugging (which sit next to your app):

-
Check whether your Profile
scheme(as xcode calls different build variants) is being build as debug or release. Both will work for profiling as far as symbols go. To know the scheme go to the Xcode menu and chooseProduct > Scheme > Edit Schemeand then on the left side of the drawer choose "Profile" then note whether the "Build Configuration" is Release or Debug for your given app and destination device. -
Find your XCode
DerivedDatafolder, which is where builds actually go. It is normally at~/Library/Developer/Xcode/DerivedData -
Recommended: clear out all the data inside
DerivedData. This makes it easier, once you do another build, to see exactly which folder gets created. -
Go back to Xcode and actually profile your app by choosing
Product > Profile. Then it will run, launch Instruments, and you should use the app to trigger meaningful work then stop the profiling run. -
Now, finally, to get the symbol names to show up in Instruments go to
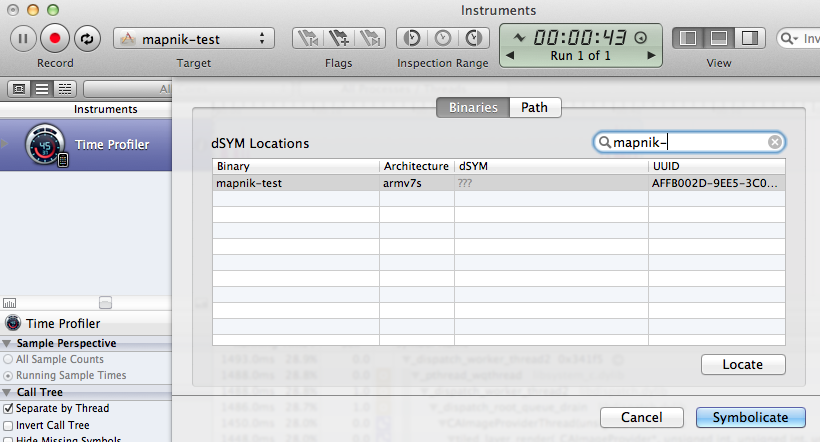
File > Re-Symbolicate Document...and you will be brought to a window like this:

-
Search for your app by name and notice the
???in thedSYMcolumn which is an indication that the symbols are missing because the app is not yet associated with a.dSYMfile. So now hit theLocatebutton and browse to~/Library/Developer/Xcode/DerivedData/<some crazy app name folder>/Build/Products/<scheme>/<app name.app.dSYM -
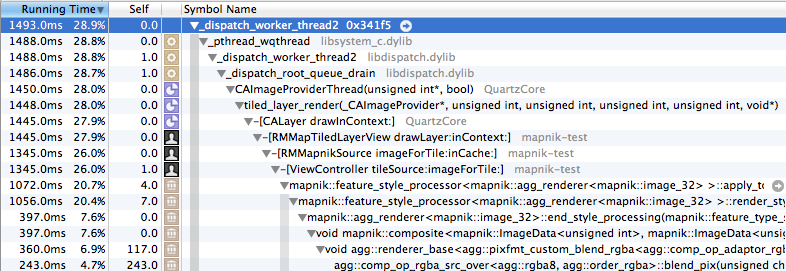
Then hit "symbolicate" back in the previous window and you should find the symbols for both mapnik and your app now showing up by name in the call stack like:
